graph_tool.centrality.eigenvector#
- graph_tool.centrality.eigenvector(g, weight=None, vprop=None, epsilon=1e-06, max_iter=None)[source]#
Calculate the eigenvector centrality of each vertex in the graph, as well as the largest eigenvalue.
- Parameters:
- g
Graph Graph to be used.
- weight
EdgePropertyMap(optional, default:None) Edge property map with the edge weights.
- vprop
VertexPropertyMap, optional (default:None) Vertex property map where the values of eigenvector must be stored. If provided, it will be used uninitialized.
- epsilonfloat, optional (default:
1e-6) Convergence condition. The iteration will stop if the total delta of all vertices are below this value.
- max_iterint, optional (default:
None) If supplied, this will limit the total number of iterations.
- g
- Returns:
- eigenvaluefloat
The largest eigenvalue of the (weighted) adjacency matrix.
- eigenvector
VertexPropertyMap A vertex property map containing the eigenvector values.
See also
betweennessbetweenness centrality
pagerankPageRank centrality
hitsauthority and hub centralities
trust_transitivitypervasive trust transitivity
Notes
The eigenvector centrality \(\mathbf{x}\) is the eigenvector of the (weighted) adjacency matrix with the largest eigenvalue \(\lambda\), i.e. it is the solution of
\[\mathbf{A}\mathbf{x} = \lambda\mathbf{x},\]where \(\mathbf{A}\) is the (weighted) adjacency matrix and \(\lambda\) is the largest eigenvalue.
The algorithm uses the power method which has a topology-dependent complexity of \(O\left(N\times\frac{-\log\epsilon}{\log|\lambda_1/\lambda_2|}\right)\), where \(N\) is the number of vertices, \(\epsilon\) is the
epsilonparameter, and \(\lambda_1\) and \(\lambda_2\) are the largest and second largest eigenvalues of the (weighted) adjacency matrix, respectively.If enabled during compilation, this algorithm runs in parallel.
References
[eigenvector-centrality]http://en.wikipedia.org/wiki/Centrality#Eigenvector_centrality
[power-method][langville-survey-2005]A. N. Langville, C. D. Meyer, “A Survey of Eigenvector Methods for Web Information Retrieval”, SIAM Review, vol. 47, no. 1, pp. 135-161, 2005, DOI: 10.1137/S0036144503424786 [sci-hub, @tor]
[adamic-polblogs]L. A. Adamic and N. Glance, “The political blogosphere and the 2004 US Election”, in Proceedings of the WWW-2005 Workshop on the Weblogging Ecosystem (2005). DOI: 10.1145/1134271.1134277 [sci-hub, @tor]
Examples
>>> g = gt.collection.data["polblogs"]
>>> g = gt.GraphView(g, vfilt=gt.label_largest_component(g))
>>> w = g.new_edge_property("double")
>>> w.a = np.random.random(len(w.a)) * 42
>>> ee, x = gt.eigenvector(g, w)
>>> gt.graph_draw(g, pos=g.vp["pos"], vertex_fill_color=x,
...               vertex_size=gt.prop_to_size(x, mi=5, ma=15),
...               vcmap=matplotlib.cm.gist_heat,
...               vorder=x, output="polblogs_eigenvector.pdf")
<...>
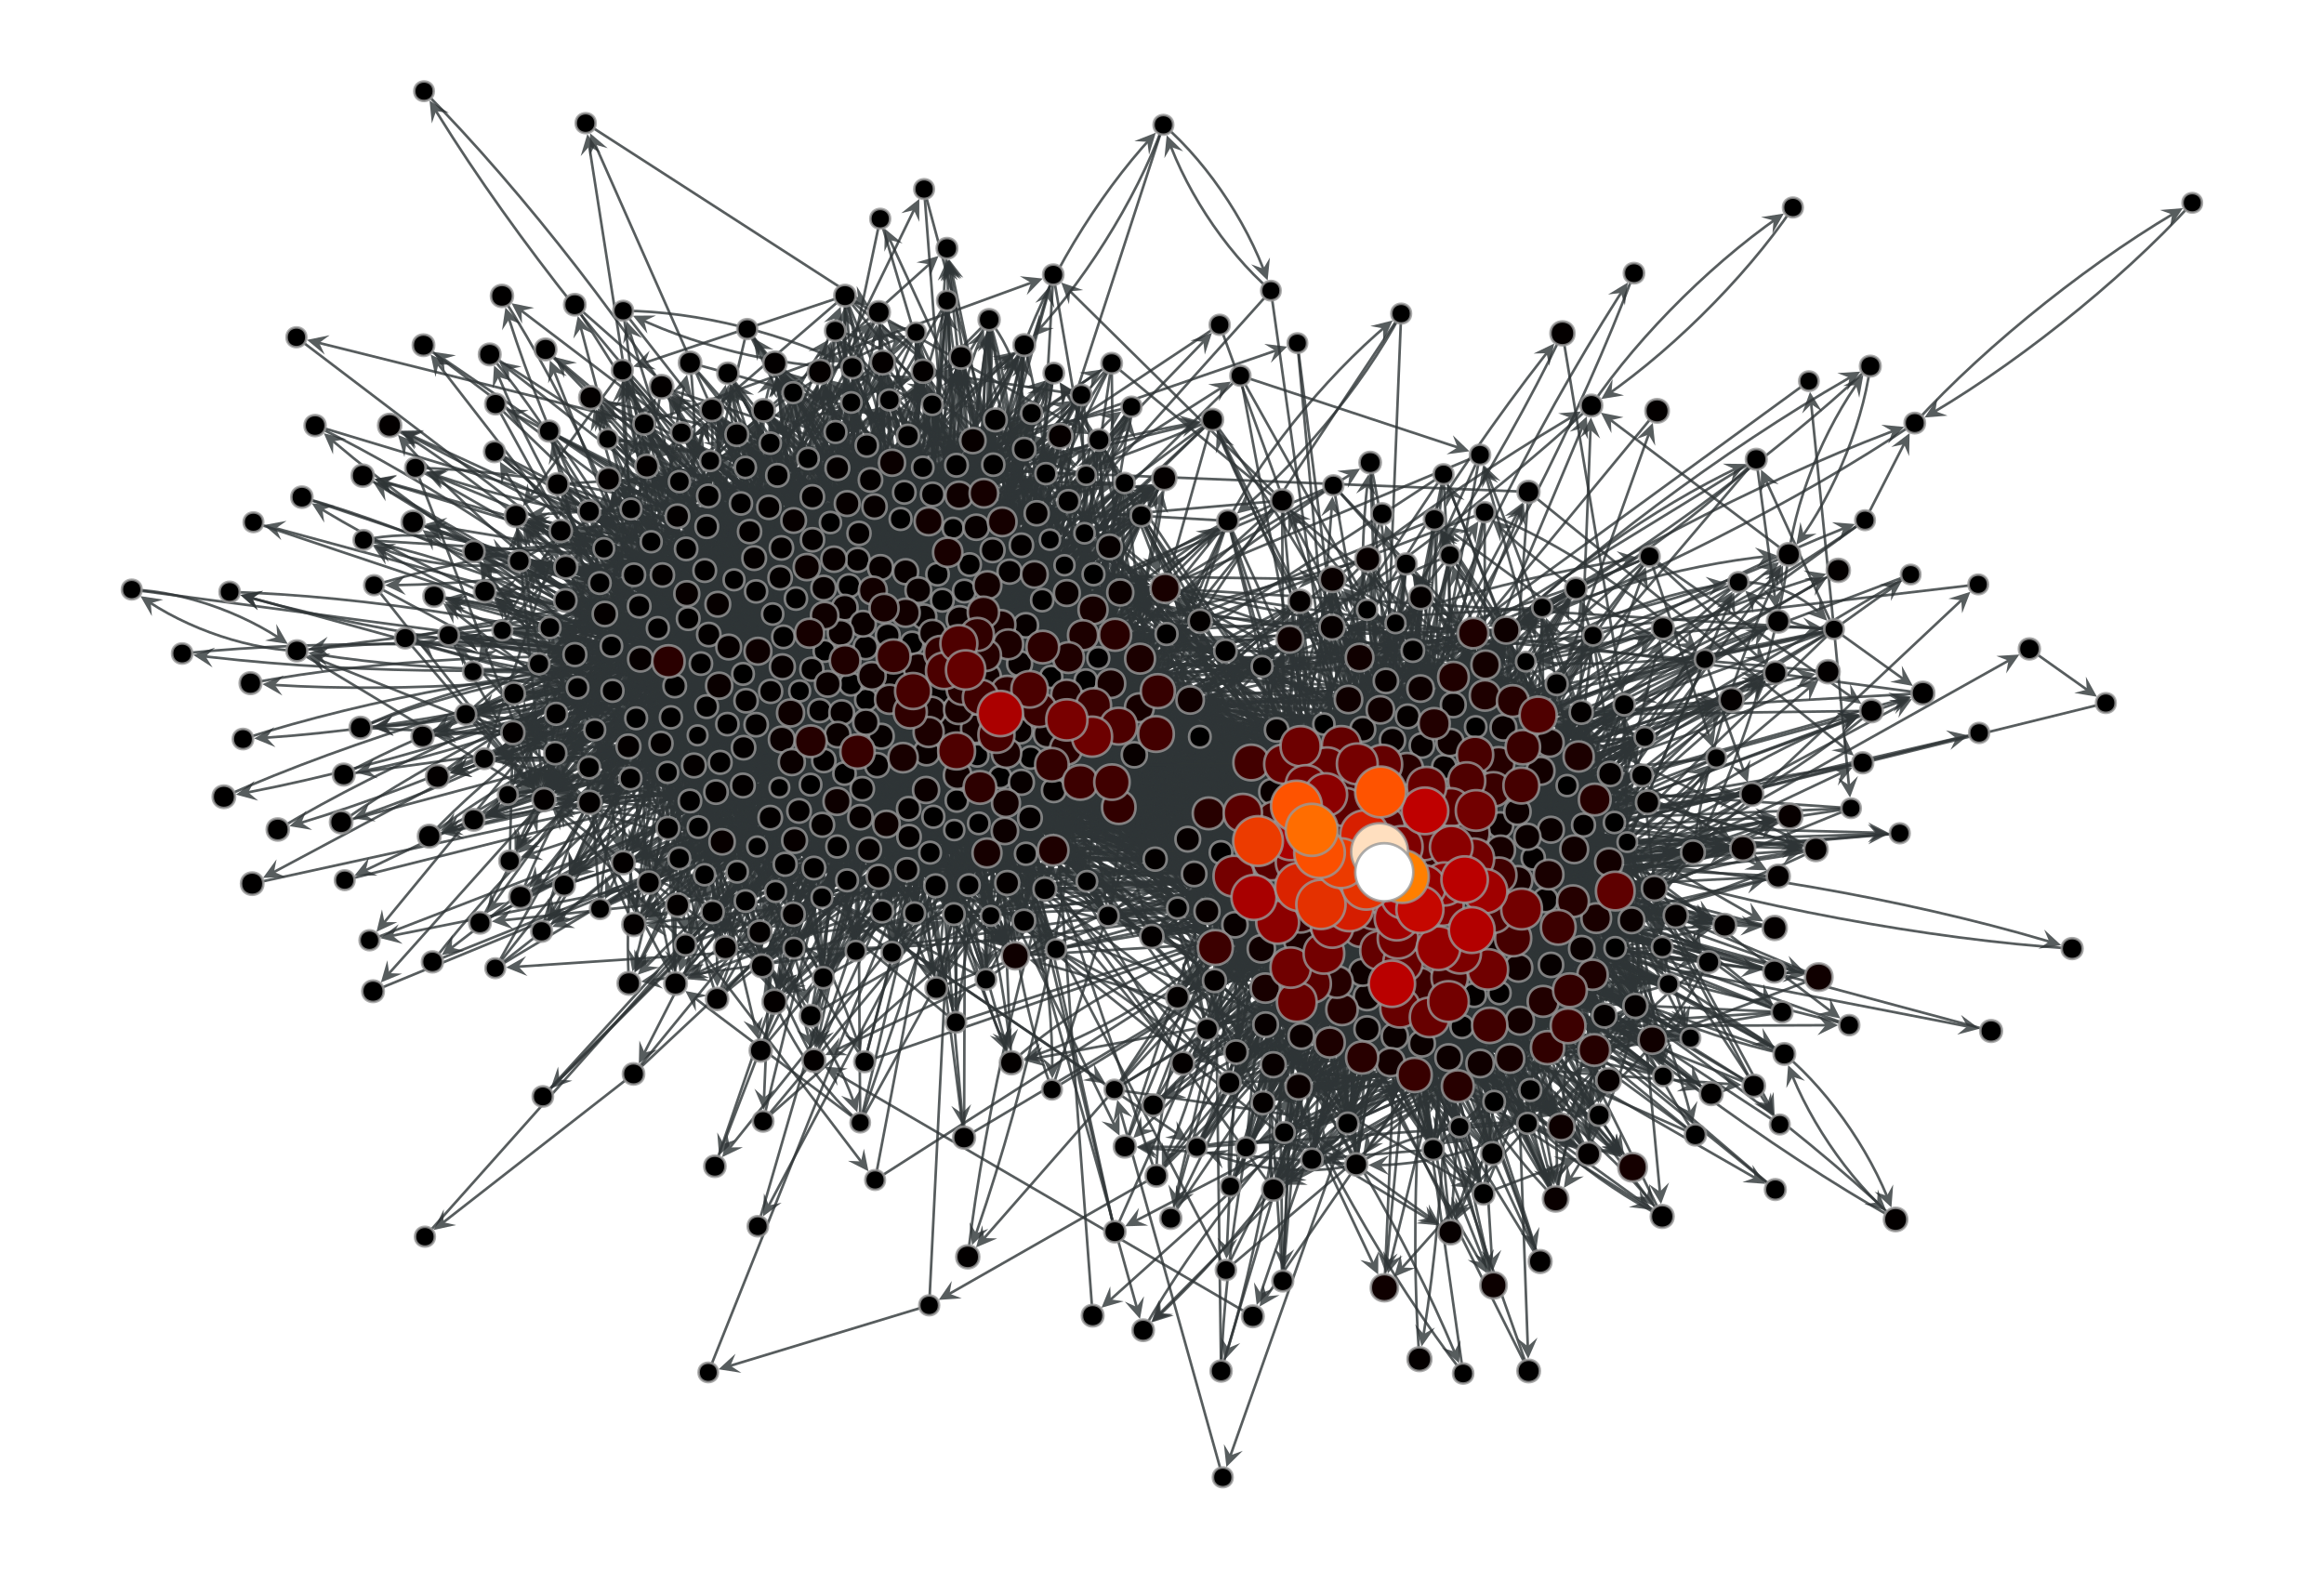
Eigenvector values of the a political blogs network of [adamic-polblogs], with random weights attributed to the edges.#