Integration with matplotlib#
The drawing capabilities of graph-tool (see draw
module) can be integrated with matplotlib,
as we demonstrate in the following.
Note
Since graph-tool uses cairo for
drawing, it is necessary to use one of matplotlib’s cairo-based
backends, otherwise integration is not possible. Currently, two
backends can be chosen: cairo or GTK3Cairo. The latter should
be chosen for interactive GUI-based figures. The backend can be
changed by calling matplotlib.pyplot.switch_backend():
import matplotlib.pyplot as plt

plt.switch_backend("cairo")
Drawing with matplotlib is done by calling
graph_draw() and passing a container (e.g.
matplotlib.axes.Axes) as the mplfig parameter. For example:
import graph_tool.all as gt
import matplotlib.pyplot as plt

plt.switch_backend("cairo")

fig, ax = plt.subplots(2, 2, figsize=(12, 11.5))

g = gt.collection.data["polbooks"]

gt.graph_draw(g, g.vp.pos, vertex_size=1.5, mplfig=ax[0,0])

ax[0,0].set_xlabel("$x$ coordinate")
ax[0,0].set_ylabel("$y$ coordinate")

state = gt.minimize_nested_blockmodel_dl(g)

state.draw(mplfig=ax[0,1])

ax[0,1].set_xlabel("$x$ coordinate")
ax[0,1].set_ylabel("$y$ coordinate")

g = gt.collection.data["lesmis"]
gt.graph_draw(g, g.vp.pos, vertex_size=1.5, mplfig=ax[1,0])

ax[1,0].set_xlabel("$x$ coordinate")
ax[1,0].set_ylabel("$y$ coordinate")

state = gt.minimize_nested_blockmodel_dl(g)

state.draw(mplfig=ax[1,1])

ax[1,1].set_xlabel("$x$ coordinate")
ax[1,1].set_ylabel("$y$ coordinate")

plt.subplots_adjust(left=0.08, right=0.99, top=0.99, bottom=0.06)
fig.savefig("gt-mpl.pdf")
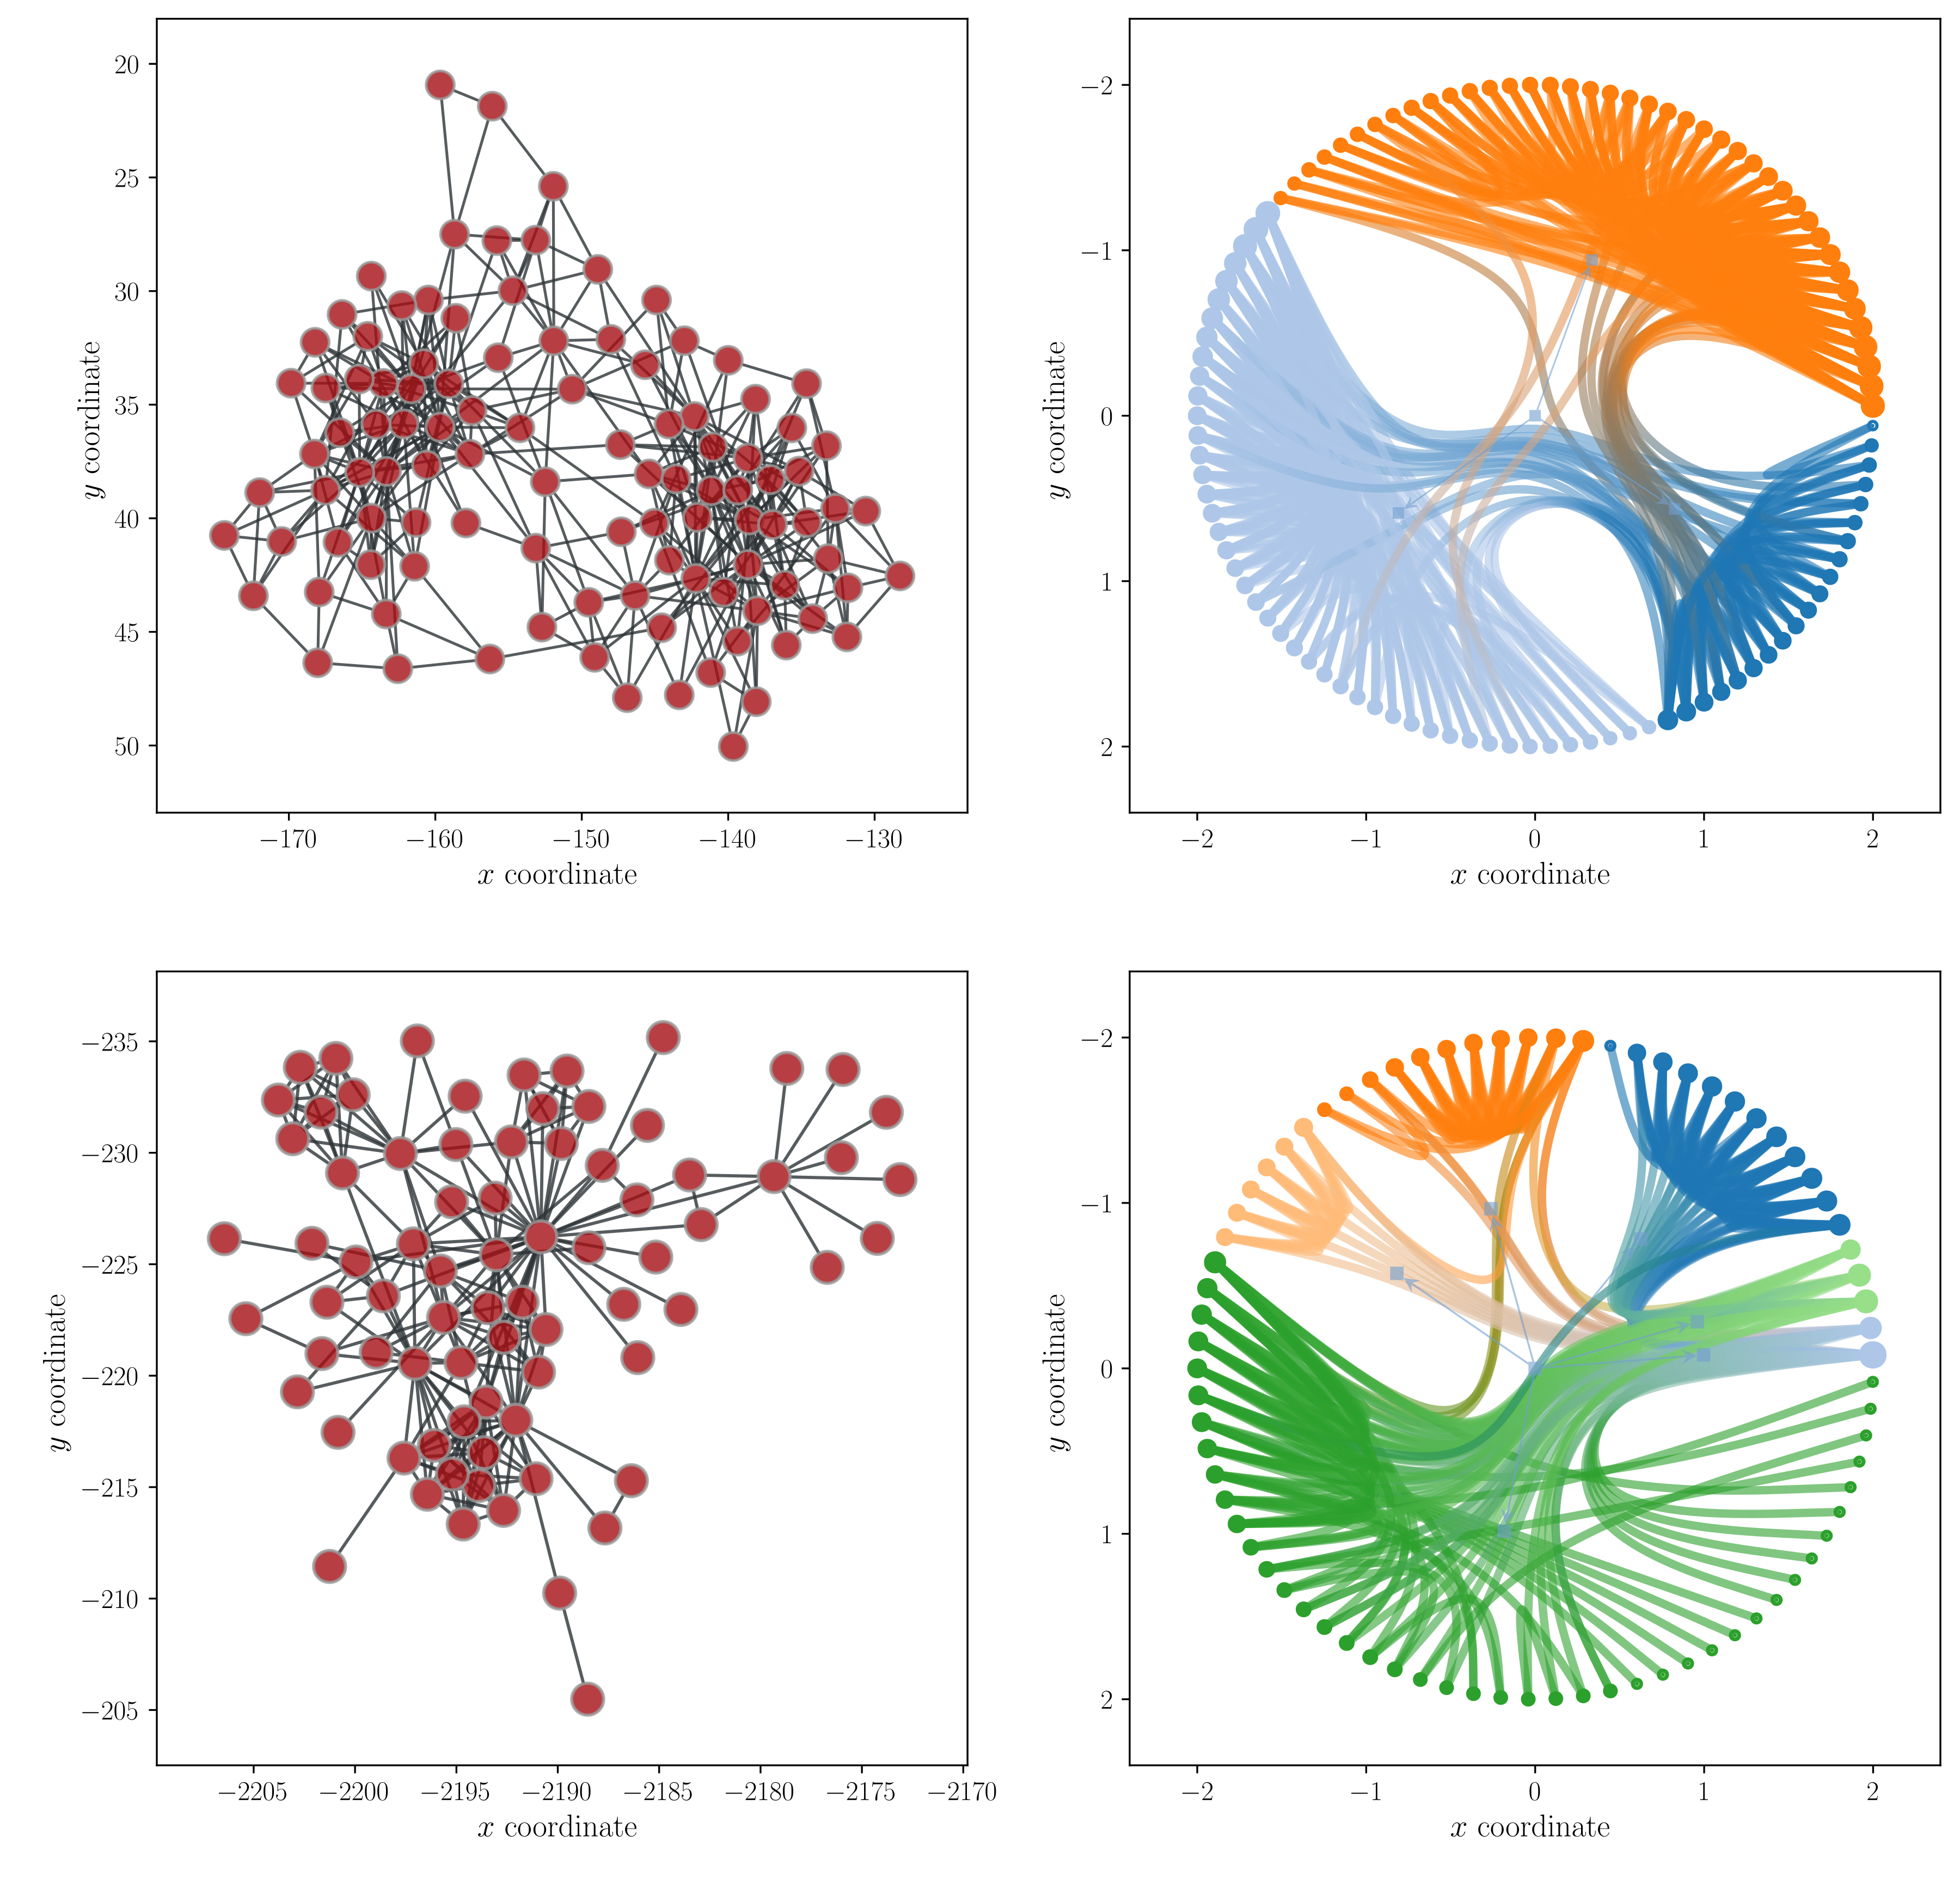
Four subplots showing networks drawn using graph-tool.#